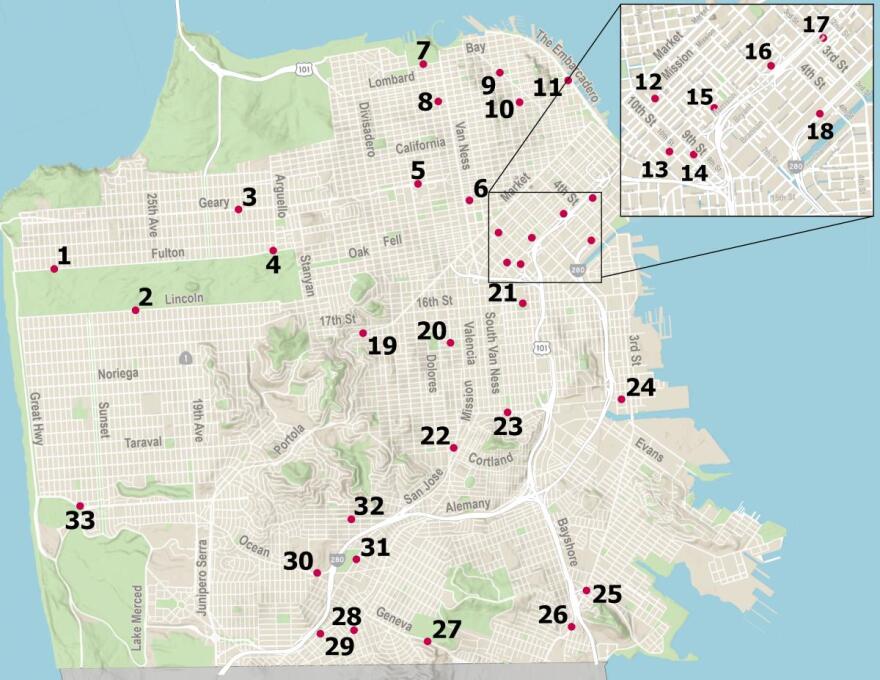
Data from over the summer shows that speed cameras caught an average of 500 violations per day in San Francisco. Cars were going an average of 14 miles per hour above the speed limit.
But, it seems like drivers are slowing down. The number of citations and warnings have steadily declined — with two-thirds of drivers not reoffending.
Speeding tickets range from fifty to five hundred dollars. Drivers get one warning before being fined unless they’re going more than 16 miles per hour above the limit — then, they just get ticketed.
Groups like Walk SF have been advocating for safety measures like this for nearly a decade. They say that they’re encouraged by the change in driver behavior. Speeding is still the number one cause of severe and fatal crashes in the city.
You can find a map of the city’s speed camera locations, along with data about specific violations here:
https://sfgov.maps.arcgis.com/apps/mapviewer/index.html?webmap=f9be1ec666404ecfb77c429f8c800dca


